Rotational Dynamics Lab

Objectives

  • Study the relationship between rotational velocity and translational velocity for an object that rolls without slipping on an inclined plane.
  • Determine the moment of inertia of the rolling object and compare with theoretical estimates.
  • Determine the angular acceleration of a rolling object.

Physics Overview

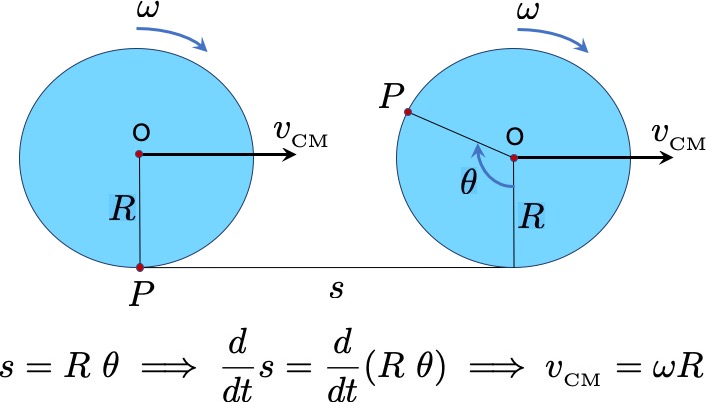
Rolling without slipping consists of two distinct motions that occur simultaneously; pure rotation and pure translation. The following figure shows an example of a disc of radius R rolling on the ground.

disc rolling on the ground

Fig. 1: A disc of radius R rolls on the ground without slipping. There is a special relationship between the centre of mass translational velocity and the rotational velocity of the disc about the centre of mass; vCM = ω R

If the disc rolls without slipping then the horizontal distance travelled on the ground is exactly equal the the arc length through which the point P moves. Then taking the derivative on both sides we immediately obtain the relationship between the translational velocity of the centre of mass and the rotational velocity about the centre of mass, when the object rolls without slipping. Notice that this relationship is a linear relationship between the two dynamic variables.


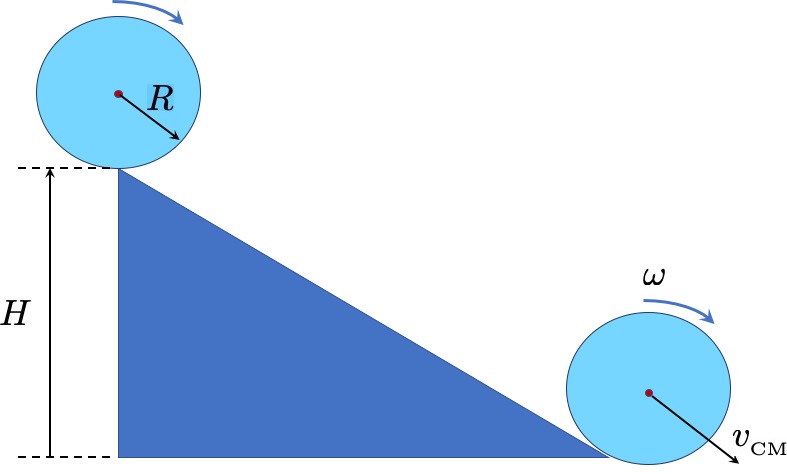
Next let us consider this object rolling down an inclined plane. Suppose the height of the incline is height H as shown in Fig. 2. Let us assume that the object starts from rest and that it rolls without slipping. This means that the relationship \(v_{_\textrm{CM}} = \omega R\) holds. Suppose the moment of inertia of the disc is I and that it has a mass M.

rolling down an incline

Fig. 2: A disc rolling down an inclined plane of height H. The object rolls without slipping. At the bottom of the incline, ω is the final rotational (or angular) velocity of the object.

We will ignore dissipative forces, as a result the object is acted upon only by gravity and static friction at its base. These are conservative forces (recall that static friction does not dissipate any energy), and hence for the system, as it moves down the inclined plane, mechanical energy will be conserved. Therefore, the total mechanical energy of the sytem at the top of the inclined plane will be equal to the total mechanical energy of the system at the bottom of the inclined plane.


Recall that mechanical energy consists of potential and kinetic energy, and for an object that rolls, the kinetic energy is the sum of its rotational and translational kinetic energies. Therefore we can write:
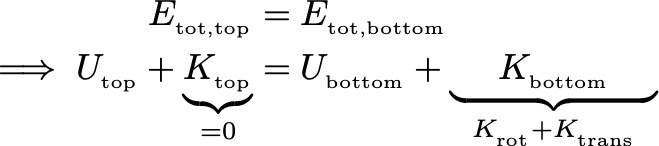

mechanical energy conservation


The potential energy of the object depends on the location of the centre of mass. Since the centre of mass of the disc is raised by R with respect to the bottom of the disc, we can write (refer to Fig. 2; we measure height from the ground upwards):


Potential energy at the top


Potential energy at the bottom


The kinetic energy of the object at the bottom of the inclined plane can be written:
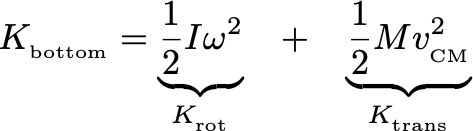

Kinetic energy at the bottom


Where ω and vCM are the final rotational and translational velocities of the object at the bottom of the inclined plane. Now we can put it all together to write:


Conservation of mechanical energy


Where we have used the relationship between translational and rotational velocity of an object rolling without slipping:
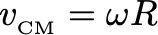

rolling formula


After some simplification we arrive at the expression:


Conservation of mechanical energy


It is left as an exercise for the student to solve for the moment of inertia (I) from the above equation. For the sake of your experiment, replace M with Mtotal and I with Itotal in the above equation. You will be rolling the iOLab device down an inclined plane and obtaining an estimate for the moment of inertia of the rolling object.

Apparatus

For carrying out the experiment you will need the following equipment:

  • iOLab Device and corresponding USB Dongle.
  • A computer with iOLab data logging software installed.
  • A Yellow Sponge.
  • A Track.
  • Ring stand base.
  • Ring stand rod (long one).
  • Track rod clamp.
  • An angle indicator/protractor.
  • A duct tape roll.
  • A measuring tape.


Give it a go!

give_it_a_go

Procedure

The following video shows what you will be doing in the lab - allowing the duct tape with the iOLab device housed inside it to roll down an inclined plane and land on the sponge placed on the floor below. Notice that while the duct tape rolls down the inclined plane it does so without slipping. Therefore it is very important to not have too steep an angle of inclination, otherwise the object will slip.


The procedure to be followed for doing the experiment is given below:

Part - I (incline set up):

  1. Set up the track at an incline using the ring stand and the track rod clamp. Attach an angle indicator or use a protractor to measure the inclination. Record the inclination angle (\(\theta\)).
  2. Measure and record the height \(H\) of the incline. See the figure above.
  3. Place the yellow sponge on the floor - try to estimate the region where you expect the duct tape roll to land - refer to the video above.
  4. Measure and record both the inner and outer diameter of the duct tape roll to determine its inner and outer radii (Ri and Ro).
  5. Measure and record the dimensions of the iOLab device, treating is a cuboid.

Part - II (determining the mass of the rolling object):

The following video shows how you will be conducting the experiment for this part of the lab in order the detemine the mass of the rolling object.


The video below shows you how to collect data for determining the mass of the rolling object:


Here is the procedure for determining the mass of the rolling object; namely, the iOLab device housed inside the duct tape roll:

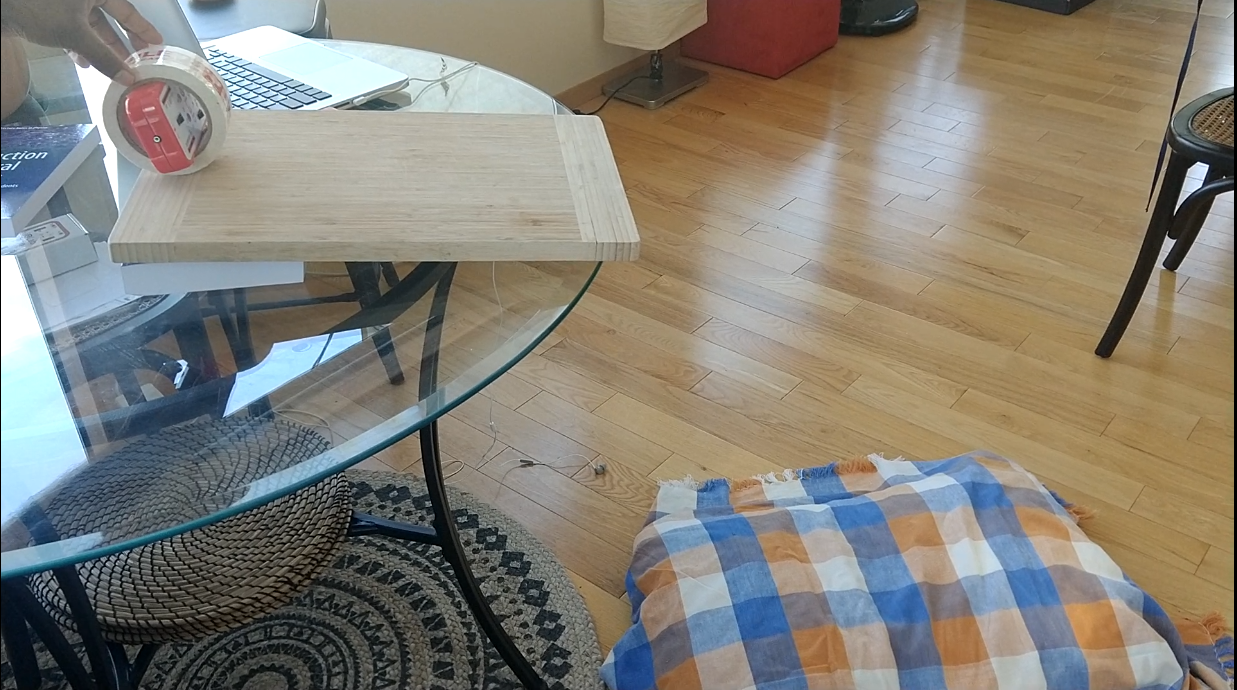
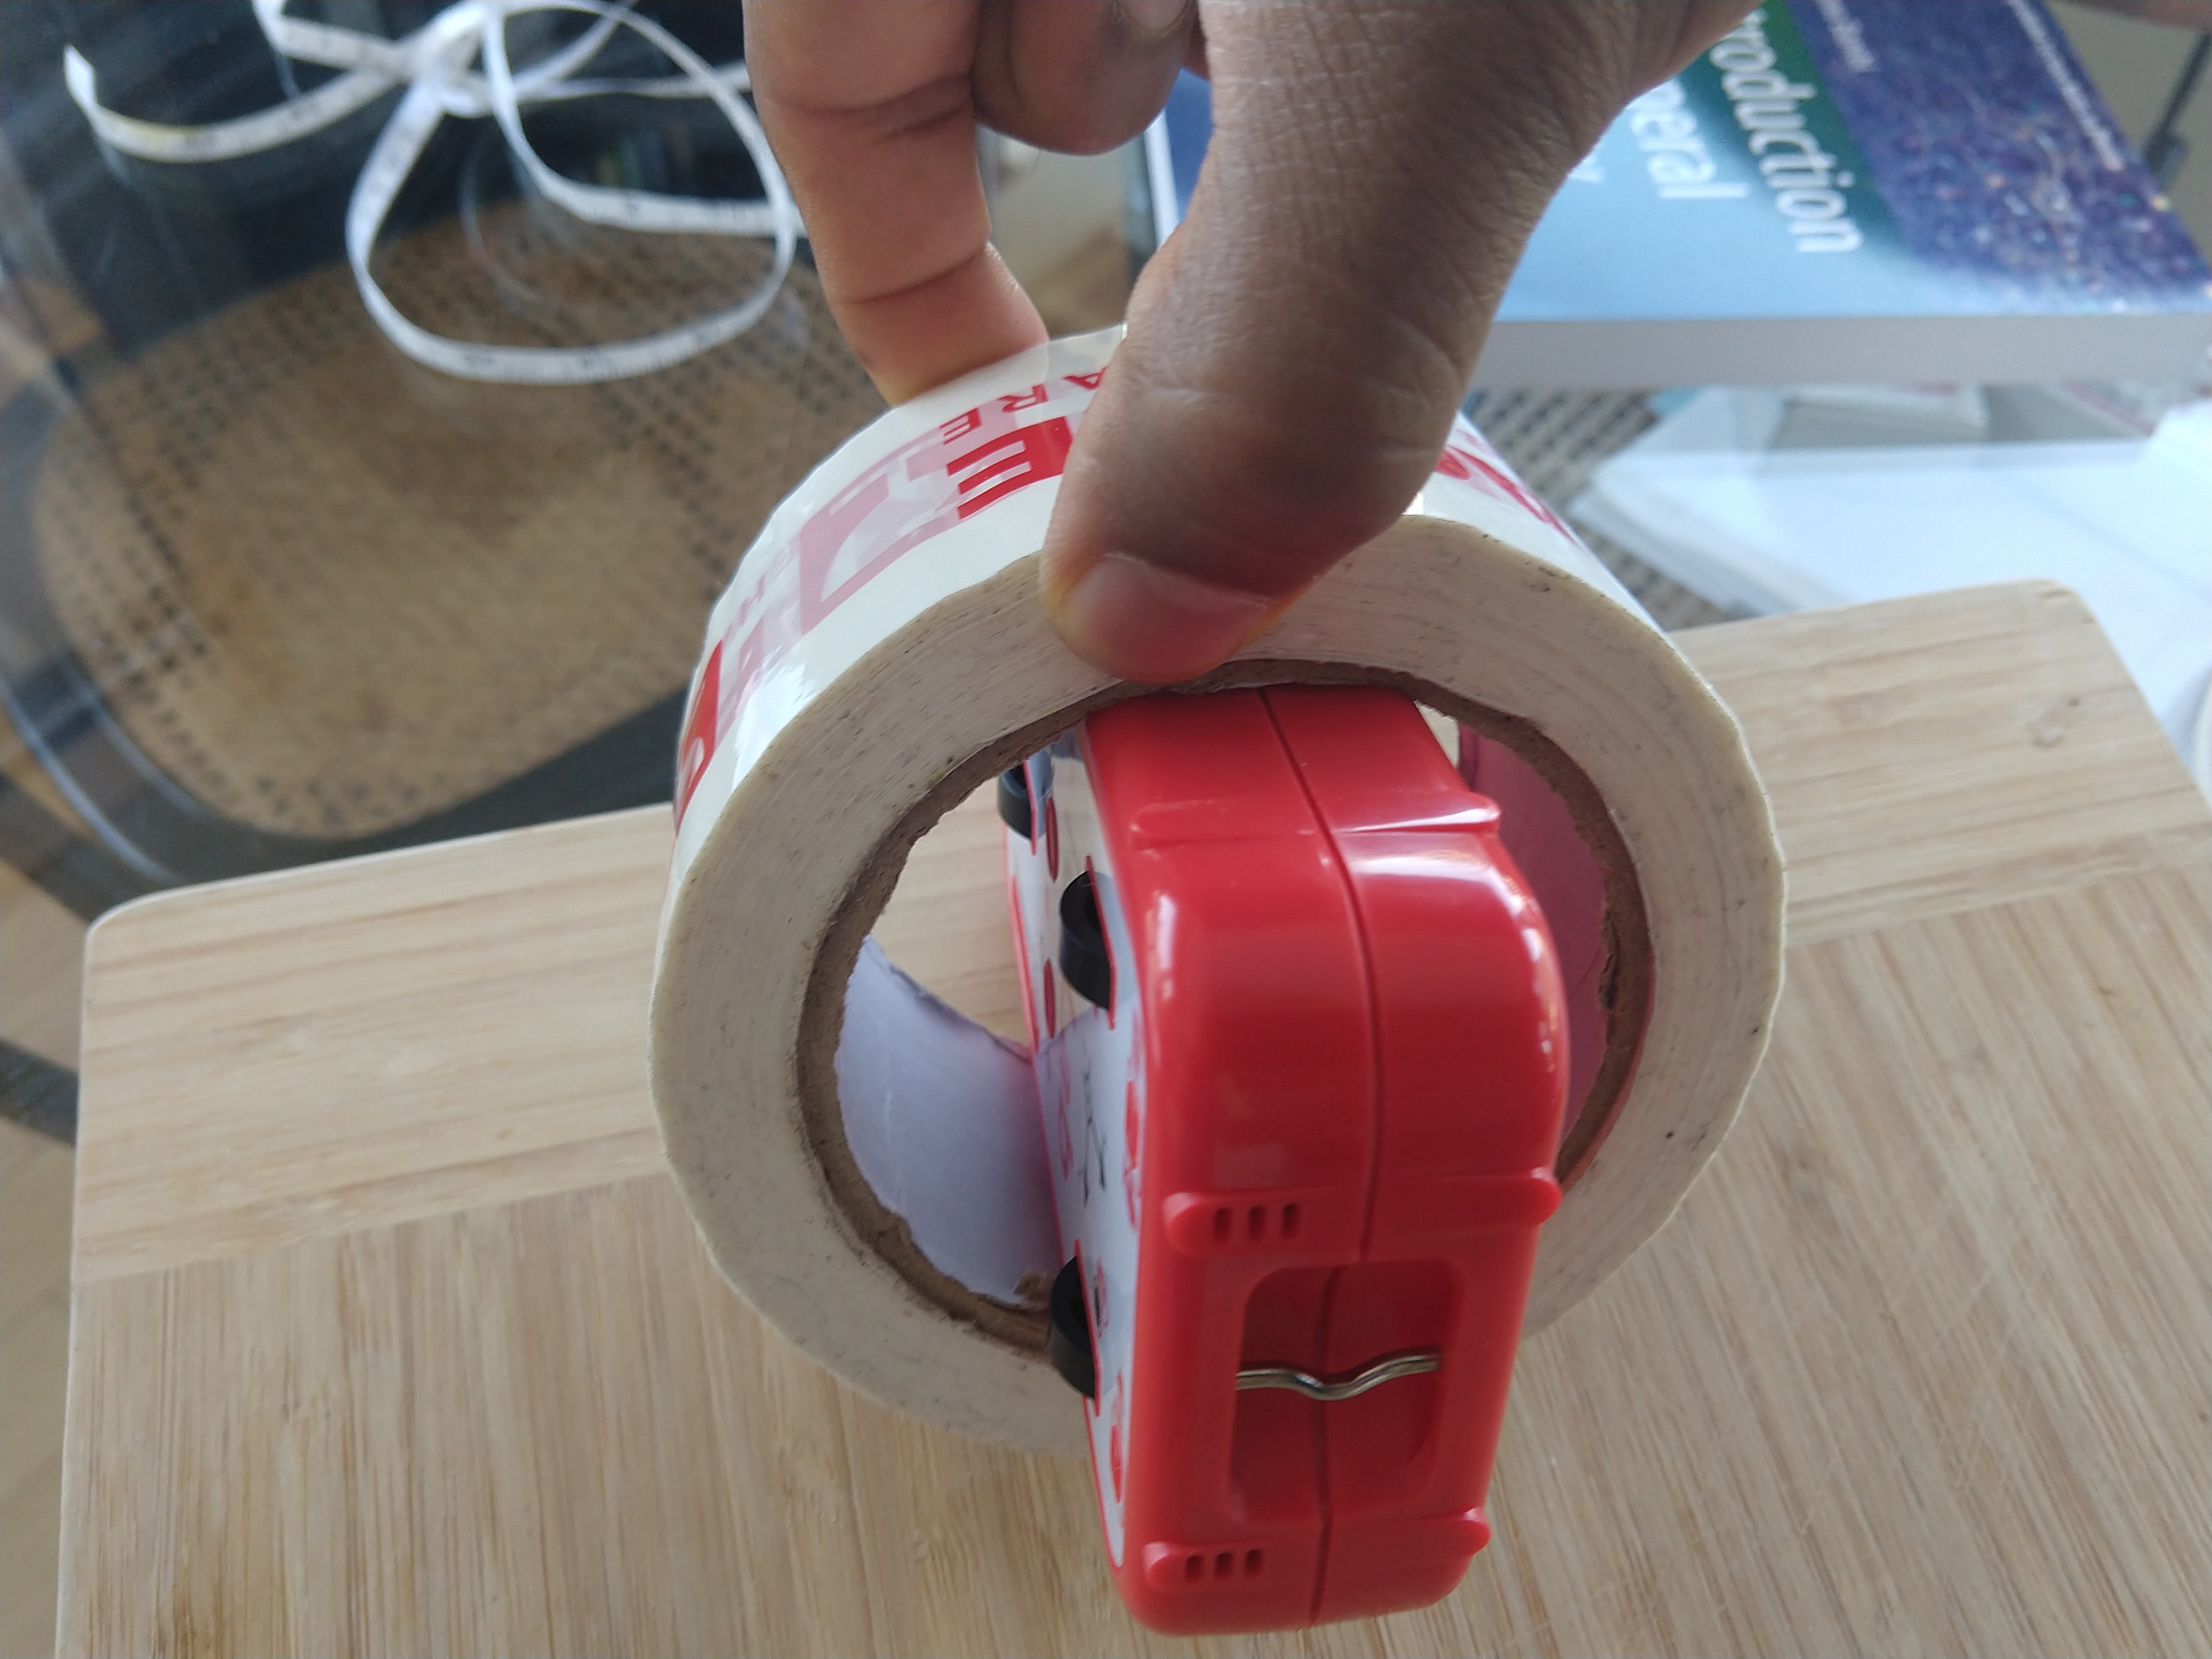
  1. First slide the iOLab device gently into the duct tape roll, ensuring that it is a snug fit (see Fig. 3). Make sure that the USB dongle is not included.
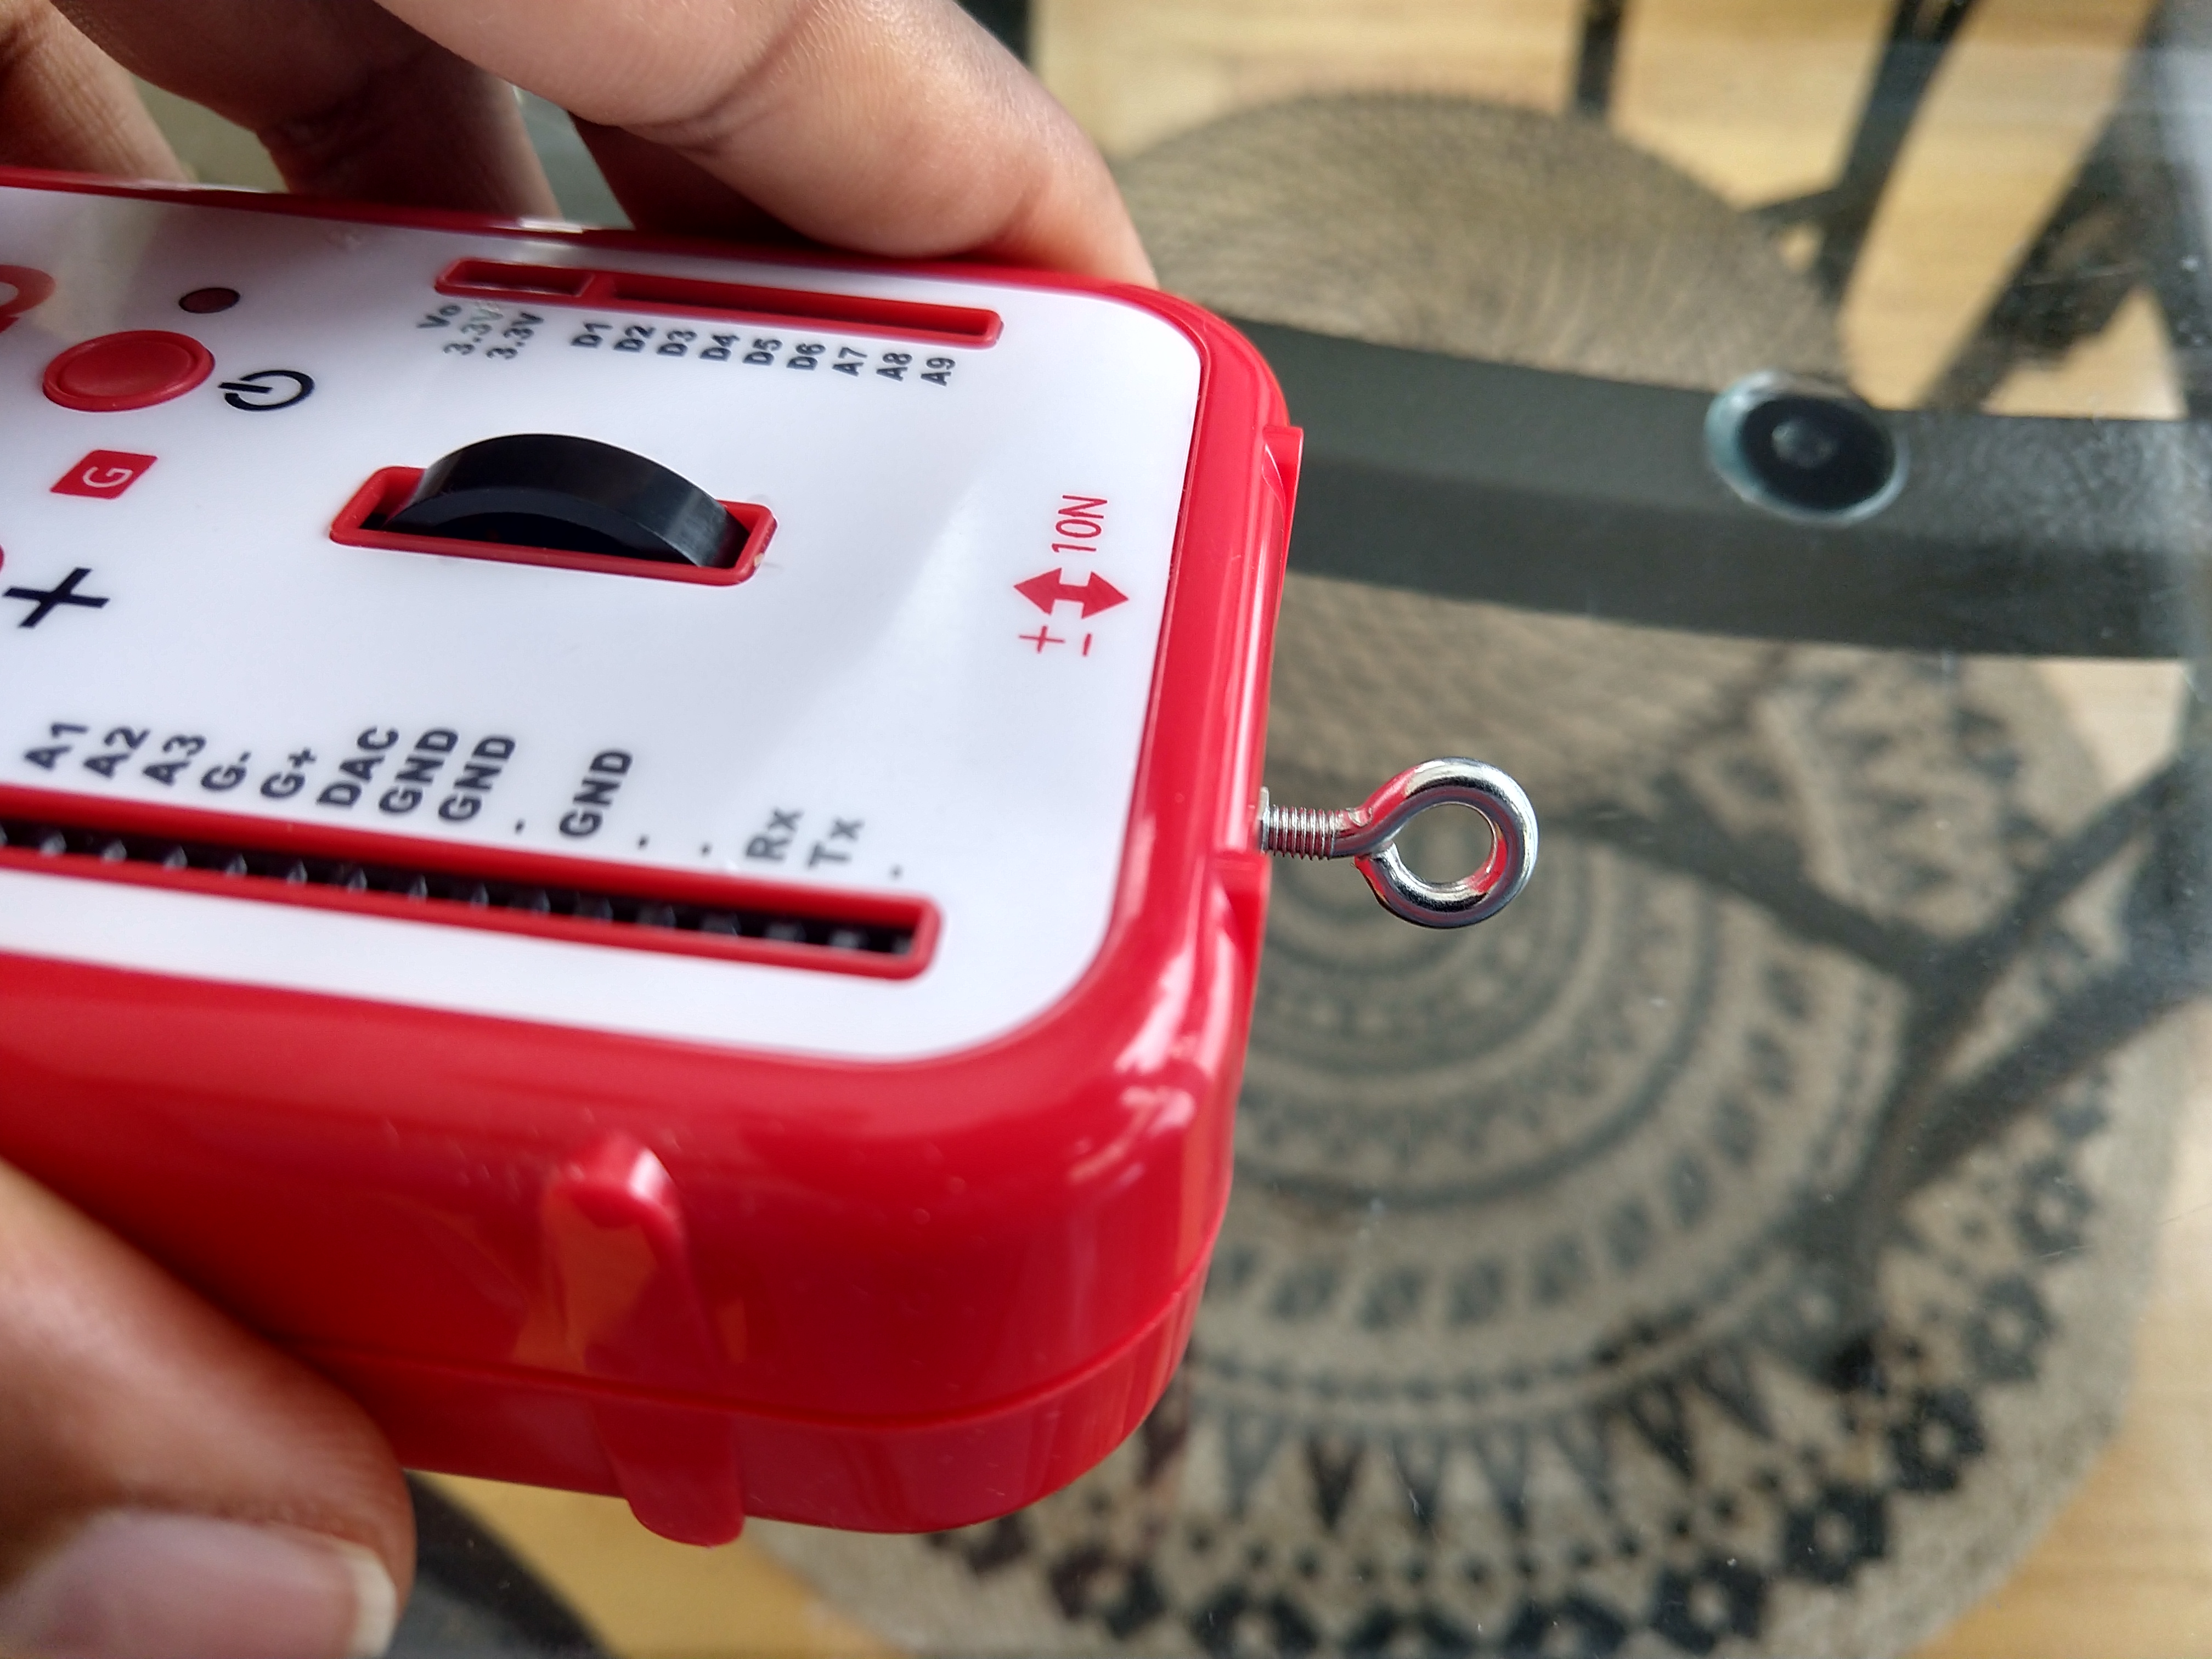
  2. Find the eye bolt from your accessory bag that shipped with the iOLab device and firmly screw it into the force sensor at the bottom of the iOLab (see Fig. 4 for reference).
  3. Place the iOLab device standing upside down on the surface of a table, the y-axis of the device should be pointing downwards.
  4. Make sure the device is turned on and the USB dongle is connected to your computer and you have the iOLab data logging software running.
  5. Select both the accelerometer and the force sensor and record data for about 10-15 seconds while the iOLab device rests on the surface of the table.
  6. While the data is getting recorded pick up the iOLab device by the eye bolt and hold it steady in the air for 5-7 seconds.
  7. Gently lower the iOLab device back onto the surface of the table and stop recording the data.

iolab in duct tape roll

Fig 3: Gently slide the iOLab device into the duct tape roll and ensure it is a snug fit.

eye bolt screwed firmly into force sensor

Fig 4: Eye bolt firmly screwed into the force sensor at the bottom of the iOLab device.

Part - III (rolling the duct tape and iOLab device):

The following video shows how you will be collecting the data for the experiment.


Here is the procedure to be followed:

  1. Ensure that the iOLab device is snugly housed inside the duct tape roll as shown in Fig. 3.
  2. Ensure that the the dongle is plugged into the computer and turn on the device.
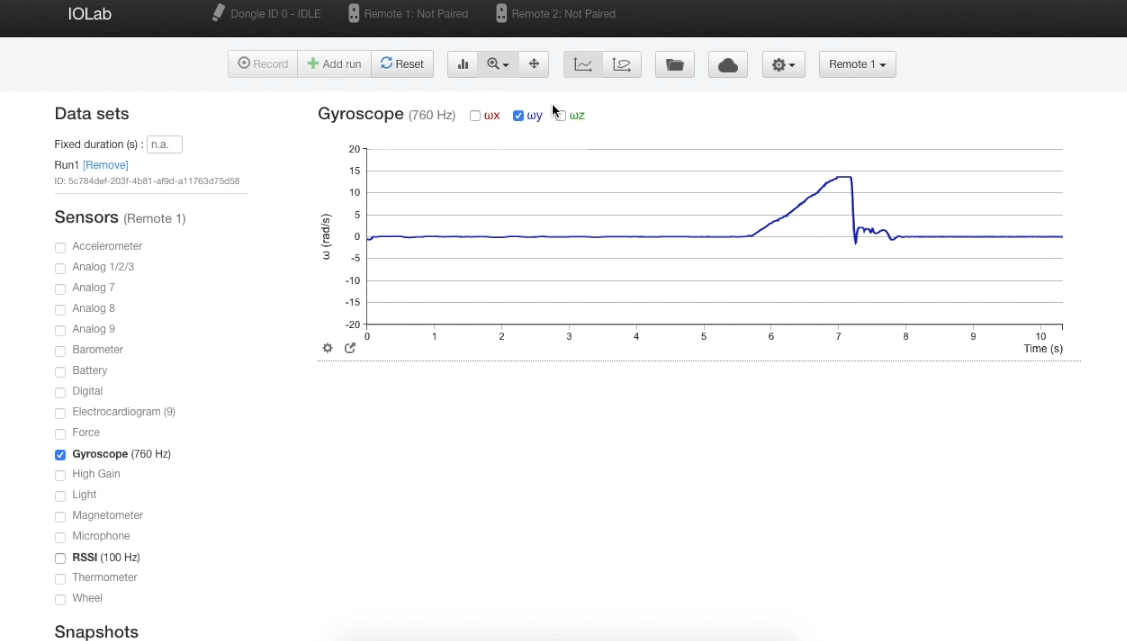
  3. Turn on the iOLab software and select the gyroscope sensor; a graph showing rotational velocity, \(\omega\) vs time should appear. Leave all three rotational velocities checked, i.e., record all three \(\omega_x, \omega_y\) and \(\omega_z\).
  4. Place the duct tape roll with the iOLab device housed inside it at the top of the incline as shown in Fig. 5.
  5. Record data for about 5-7 s before letting go of the roll and allowing it to roll down the inclined plane.
  6. Stop recording data after the roll has come to a stop on the sponge below.
  7. Now change the inclination, and repeat steps 1-6 above. Each time note down both the height of the incline and the inclination angle. Repeat until you get four sets of data, one for each inclination Each time ensure that the duct tape roll's initial starting point is the same on the incline. This will give you data for how the final rotational velocity of the rolling object depends on the inclination angle. Make sure that when the duct tape rolls down the incline it does so without slipping each time.

initial starting point on incline

Fig 5: Initial starting point for the duct tape roll on the incline. Ensure that this starting point is the same, every time you change the height to repeat the experiment.

Data Analysis


Part I: Determining the mass of the rolling object.


The following video shows how to analyse the collected data for determining the mass of the object (iOLab device inside the duct tape roll):


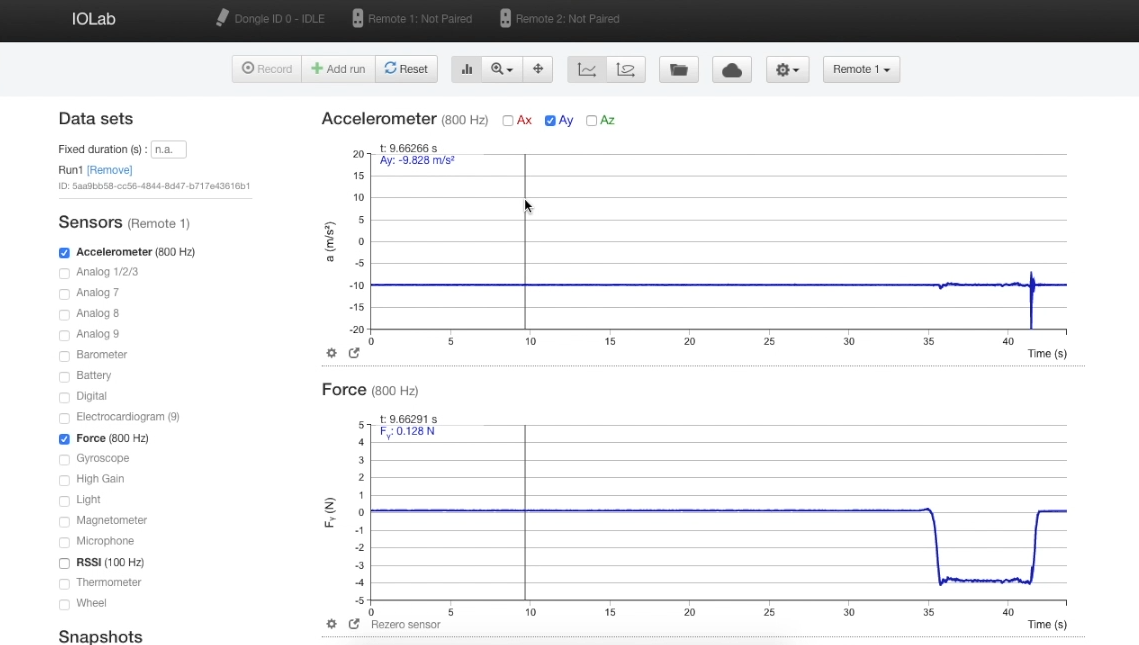
The figure below shows an example of what your data should look like after you have removed the data for \(A_x\) and \(A_z\):

A y and F y as functions of time

Fig 6: An example of what your data should look like. In the top graph you should have data for \(A_y\) as a function of time; \(t\).

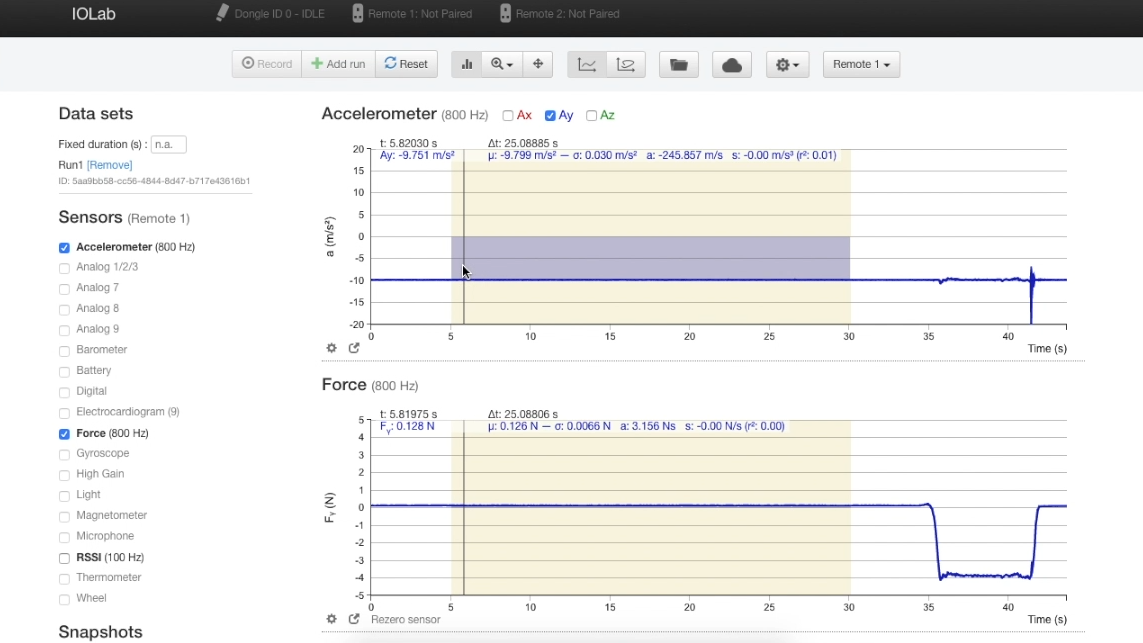
The figure below shows how to determine the average value of the acceleration due to gravity by selecting the appropriate portion of the data:

determining acceleration due to gravity

Fig 7: Select a large flat portion of the acceleration data (\(A_y\)) before you lifted up the iOLab. The average value for the acceleration due to gravity should be close to \(9.8~\)m/s\(^2\). Also determine the average value of the residual force reading in the data from the from sensor.

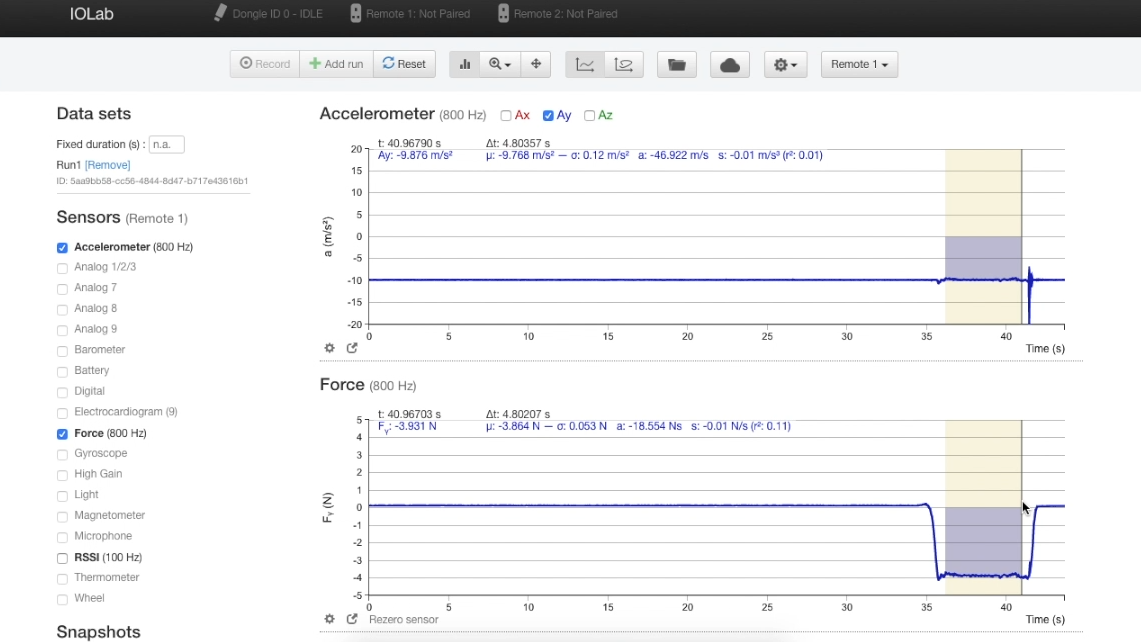
Next select a portion of the data for the force sensor during the time interval when you picked up the device and held it stationary in the air:

determining the force of gravity

Fig 8: Select a portion of the force data when you lifted up the device and held it stationary. Note down the average value the force sensor reads. The difference from the residual value is the force due to gravity. Be mindful of the signs when determining this difference.

Part II: Rolling without slipping.


The following video shows how to analyse the data you have collected for the rotational velocity of the object as it rolls down an inclined plane:


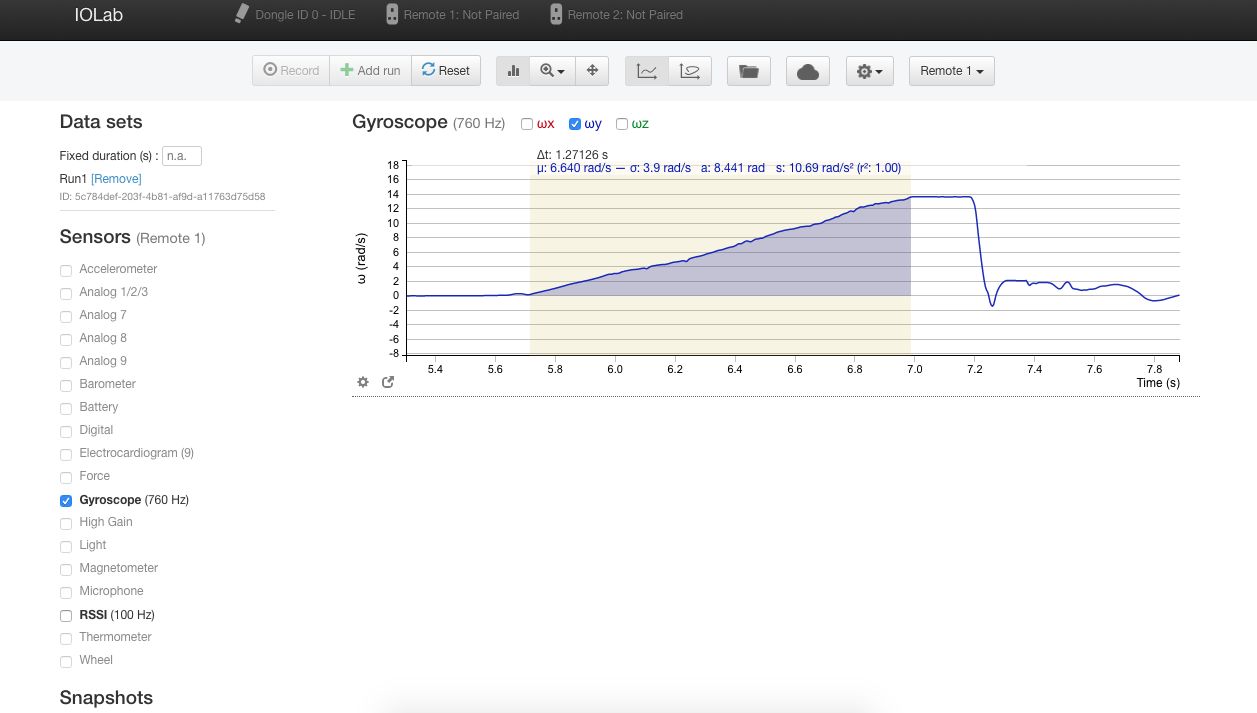
The anngular acceleration \(\alpha\) is just the slope of the rotational velocity. Note down this value for each run.

The figure below shows an example of what your data should look like after you have removed the data for \(\omega_x\) and \(\omega_z\):

omega y versus time

Fig 9: An example of what your data should look like after you have removed the data for \(\omega_x\) and \(\omega_z\).

The figure below shows what your data should look like after you have zoomed in and selected the linearly increasing portion of the data; \(\omega_y\) increases linearly with time, \(t\).

angular acceleration and final angular velocity

Fig 10: An example of what your data should look like after you have selected the linearly increasing portion of \(\omega_y\). The slope is the angular acceleration and the final value just before it falls off the incline is \(\omega_f\).

Once you have obtained \(\omega_f\), you can substitute it into the expression for conservation of mechanical energy and then determine the experimental value for the moment of inertia \(I\) of the rolling object.


Report Considerations

Make sure you include the following in your lab report:

  • Include ONE (1) example snapshot showing your analysis of the data for the mass of the object (see Fig. 8 above).
  • Include ONE (1) example snapshot showing your analysis of the data for rolling without slipping (see Fig. 10 above).
  • Provide the following in your report:
    1. A clear plot of \(\omega_f\) vs \(H\).
    2. A data table showing experimentally determined values of \(I\) and \(\alpha\) when you vary the height \(H\) by changing the incline (see Figure 11 below).
  • Describe the errors in your measurements.
  • Describe what you learned from the graph of \(\omega_f\) vs \(H\)? Is the trend what you would expect from theory? Can you derive this?
Questions to answer in the discussion section.
  • Determine average value for I for the runs you have done (see Fig. 11 for reference).
  • Is the experimentally determined value reasonable for the moment of inertia? (See Fig. 12 for reference.) How does your experimentally determined value for the moment of inertia compare with the theoretical one if \(M_{_\textrm{duct tape}} \approx 192~\)g and \(M_{_\textrm{iOLab}} \approx 203~\)g? How does the experiment value of \(I\) compare with the theoretical one (see below for expression)? [Hint: If you combine the iOLab with the duct tape what will be the total moment of inertia? Think about combining a cuboid with a hollow cylinder.]

sample data table

Fig 11: Sample data table you must include in your report.

angular acceleration and final angular velocity

Fig 12: Moments of inertia of a hollow cylinder and cuboid when rotated about an axis through the centre of mass in the orientation shown.